


Sometimes people are motivated to dig deep and analyse their finances on their own terms. The new functionality in Meniga’s customer facing solution, which we call Custom Reports, makes this easy and fun.
Your finances at a glance
While financial health is important, people have many other priorities in life. That is why we at Meniga design our customer platform with engaging byte sized weekly and monthly reports in our activity feed. One tap on those reports will show a clear breakdown of spending by categories. Likewise, our overview screen is designed to be understood in a quick glance.
Feeling motivated to create your own reports?
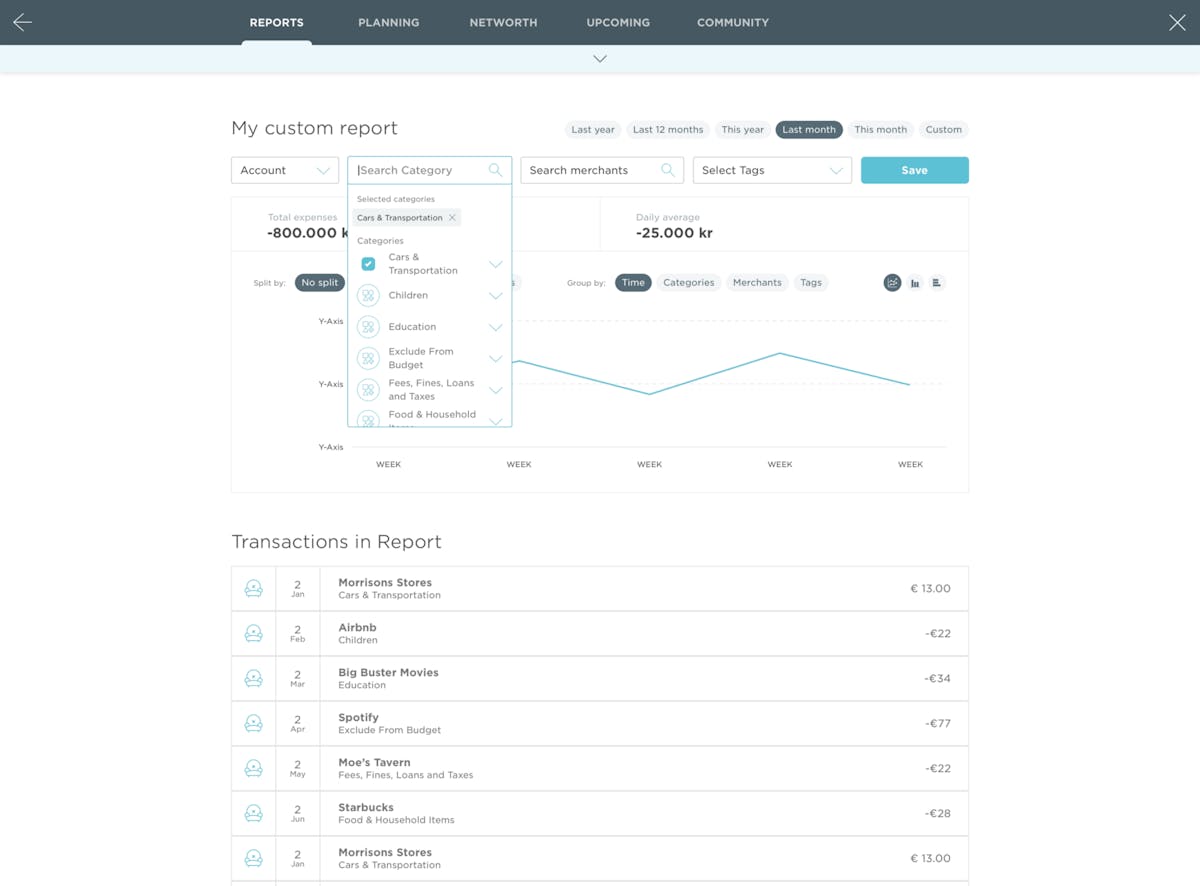
When our users are motivated to create their own reports they use our new Custom Report interface. It is designed to be granular, flexible and fun to use and look at. In this new interface, the reports can be generated for different time periods by the dimensions below.
Account data from all over the banking universe
In our customer facing platform in Iceland we aggregate banking data from three of the major banks here. So, if you are in a household where you and your partner use different banks, credit card and bank accounts, that is no problem at all. Actually, we are so excited about the aggregation and consolidation of banking data, these are our favourite use cases!
Categories
We recognize that life is complicated. Therefore, we offer many spending categories. While our categorisation engine uses machine learning to categorise transactions automatically we allow our users to edit transaction categorisation or to split a transaction between one or more categories.
Our categorisation engine learns from these adjustments so you could say that we have crowdsourced transaction categorisation. It is easy to create custom reports by one or more categories. So for example, a report which shows a combination of spending for ‘Vacation & Travel’ and ‘Leisure Time’ is easy to generate.
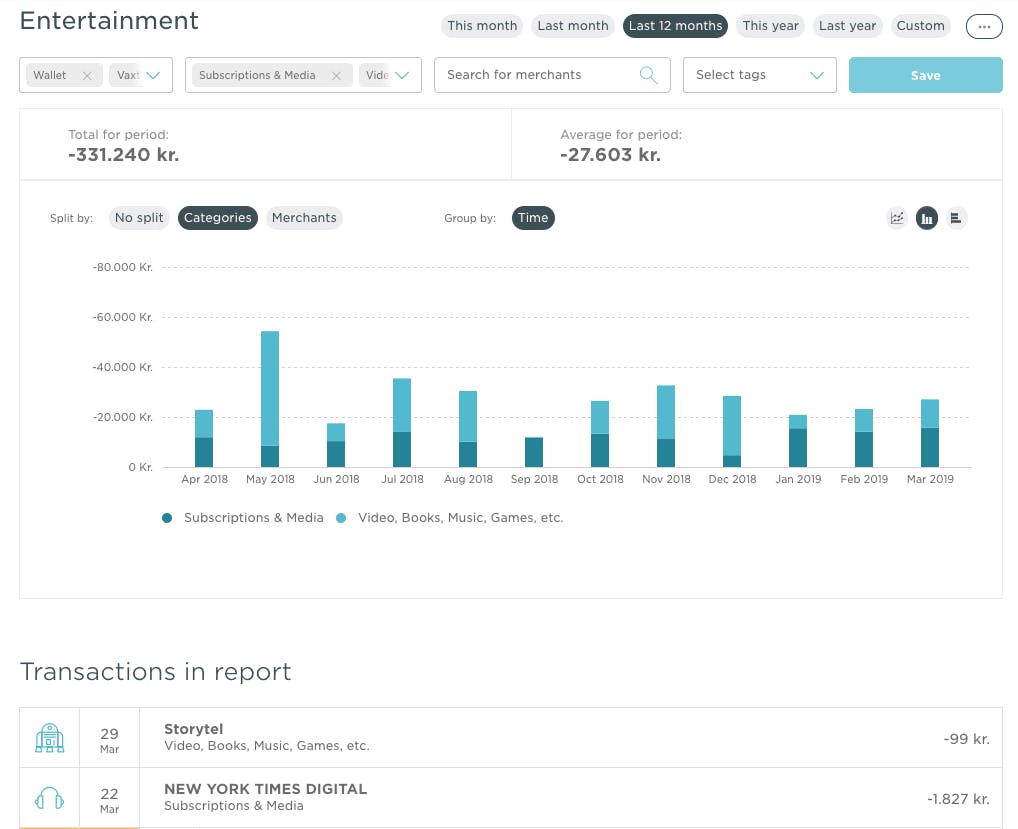
Merchants
Our platform has robust merchant mapping. I am always delighted to see my Meniga account accurately categorises my transactions from such different places as Boston or Vilnius. Of course we enable people to create custom reports from merchants they want to track spending for. This means that you could track your spending on unhealthy things by grouping together spending from merchants which sell candy and fast food.
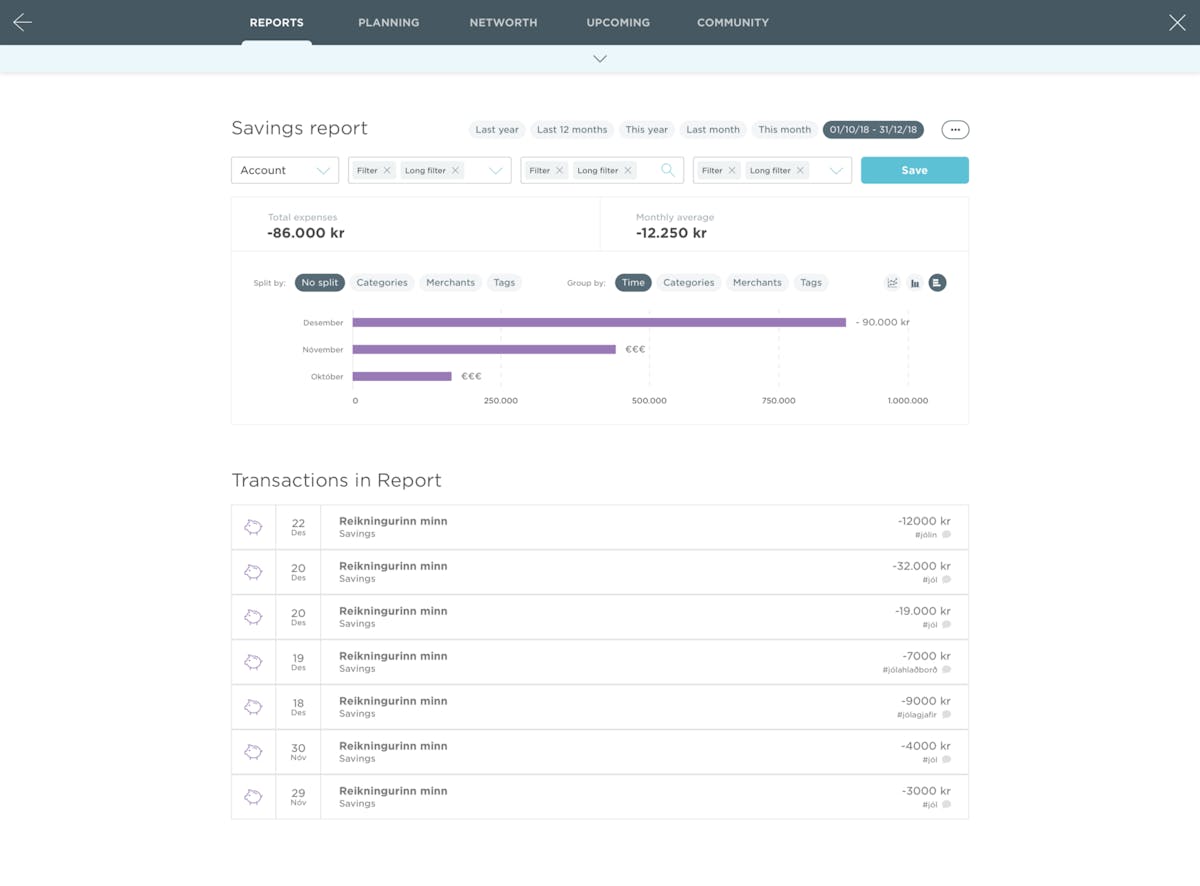
Tags
A clever trick available to Meniga users is to tag categories. A colleague of mine tags all transactions related to her summer vacation across family bank accounts, credit cards, categories, accounts or merchants. This enables her to create a better estimate of how much money she needs to save for her holidays. She is then able to create a tag based report titled ‘Summer vacation 2019’.
Create your own combination
It is worth noting that custom reports can be generated as a combination of these above dimensions. So for example, it is easy to create a custom report which is a combination of accounts, merchant data, categories and tags.
Save for a rainy day
All of this may sound like a lot of work but it really isn’t. The maxim, ‘If I can do it, you can do it’ certainly applies here. The best part is this. When users have saved reports and given them a name the reports automatically update as time goes by.
What a time to be alive!