


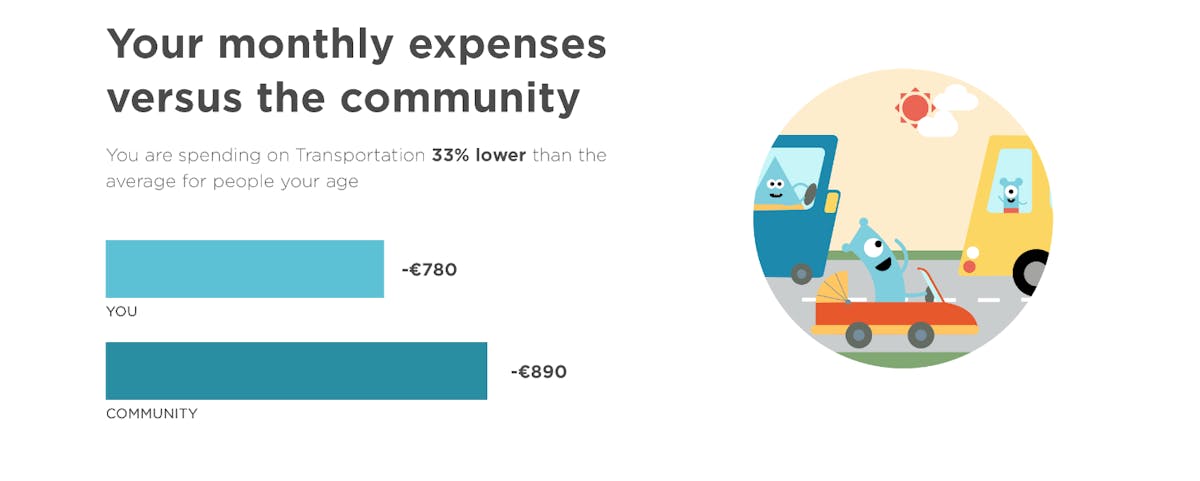
We just launched a new user interface for the community feature for our customer facing platform in Iceland. This enables our users to compare their spending with their demographic group. Our users see how their spending for important categories compares with other people like themselves.
The community feature shows users how they compare with their peers in different categories. The user’s peer group consists of people in the same zip code, income bracket, age and gender. Since we consolidate and aggregate data from all the major banks here in Iceland, our users get a holistic comparison with their peers.
Motivate with curiosity
Curiosity is an important motivator and the usage levels for the Community feature demonstrate this. Essentially, the community feature gives users a way to benchmark themselves against their peers. As you would expect, this can make people pause and an induce to rethink and change their spending habits.
It can also be a way to affirm your lifestyle. Personally, I am gratified to see that since I cycle to work, my spending on transport is way below my peers in transport. This enables me to have more fun, I spend more than the community in the lifestyle category. Less driving not only means more exercise and more relaxed commute. It also means that I have the opportunity and the means to enjoy more of the finer things in life.
Should my bank choose to give me the community feature in its app, it would potentially know more about what kind of person I am. It would be able to tailor its offerings to me and engage me via the community feature. One fine day it happen!
Be a financial advisor, get more data and build your fanbase
The community feature does not only enables banks to understand their customers better. It could gives them a way to advise customers on how to adjust spending habits. So if a customer is spending far less on insurance it could be relevant to nudge that person to check if she has inadequate insurance cover.
This helps banks to position themselves as financial advisors which convert passive users into customers and then fans. Additionally, if people want to see more accurate comparison with their peers, they might want to volunteer more data points about themselves. It is a win win situation for the bank and its customers.
Community categories
The Meniga community has the following categories:
Transportation
This category shows how much it costs to get around. It includes things like gas & fuel, auto loan or lease, auto service and expenses, and finally taxis and public transport.
Living
The ‘Living’ category details mundane but vital parts of everyday life. These are utility costs and regular payments such as home insurance, electricity and heating, phones and internet, mortgage and finally student loan payments.
Lifestyle
This is where all the fun is. Or should we say, this shows how much it costs to have a good time while looking great. Entertainment and nightlife, subscriptions and media, cycling, gym and sports, clothing and accessories, movies and concerts and finally vacation and travel are included in this arguably most fun category.
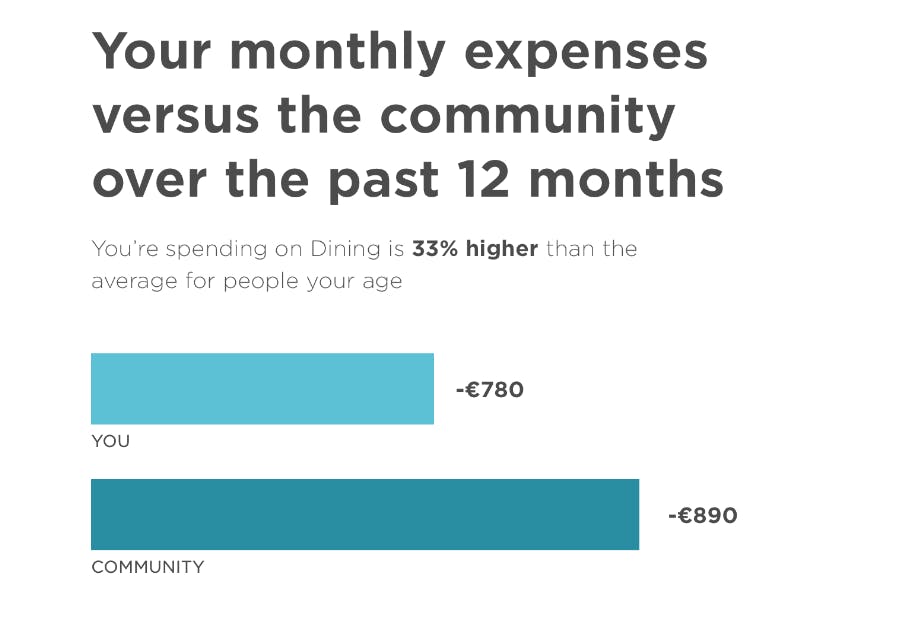
Visual way to understand spending
The interface shows the users the biggest merchant in each category which is an important addition to the insights this interface provides. In conclusion, the community feature gives users of your digital banking services fun and visual way of understanding how much they earn, spend and save in comparison to people like themselves.
More information on www.meniga.com